
November 6, 2026
The Test: How a Bubble Shakes Out the Leveraged Bulls
George Soros's reflexivity playbook, five historical examples, and a live scorecard for the AI trade.
The idea
In a reflexive bubble, rising prices improve the fundamentals. Capital gets cheaper, demand grows, and leverage builds on both. Prices and fundamentals feed each other until the loop is tested. Soros's observation was that every major trend goes through such a test, usually a sharp break, and that what happens next tells you which regime you are in.
1. The test
Price breaks hard, usually 20 to 35 percent. Margin and momentum holders are forced out, the narrative turns negative, and volatility spikes. This is the uncomfortable part for everyone who owns the asset. It is also where the information is.
2. The verdict
If the decline fails to clear the bulls, meaning price holds above the prior base, breadth recovers and dip buyers win, the trend has proven itself. If it keeps breaking, the bulls were cleared and the bubble is over.
3. The acceleration
After a passed test the move extends further and longer than most people expect, because the survivors add size and the doubters capitulate. Investors who held through the test are positioned for it.
Five tests, three outcomes
| Episode | Outcome | What happened |
|---|---|---|
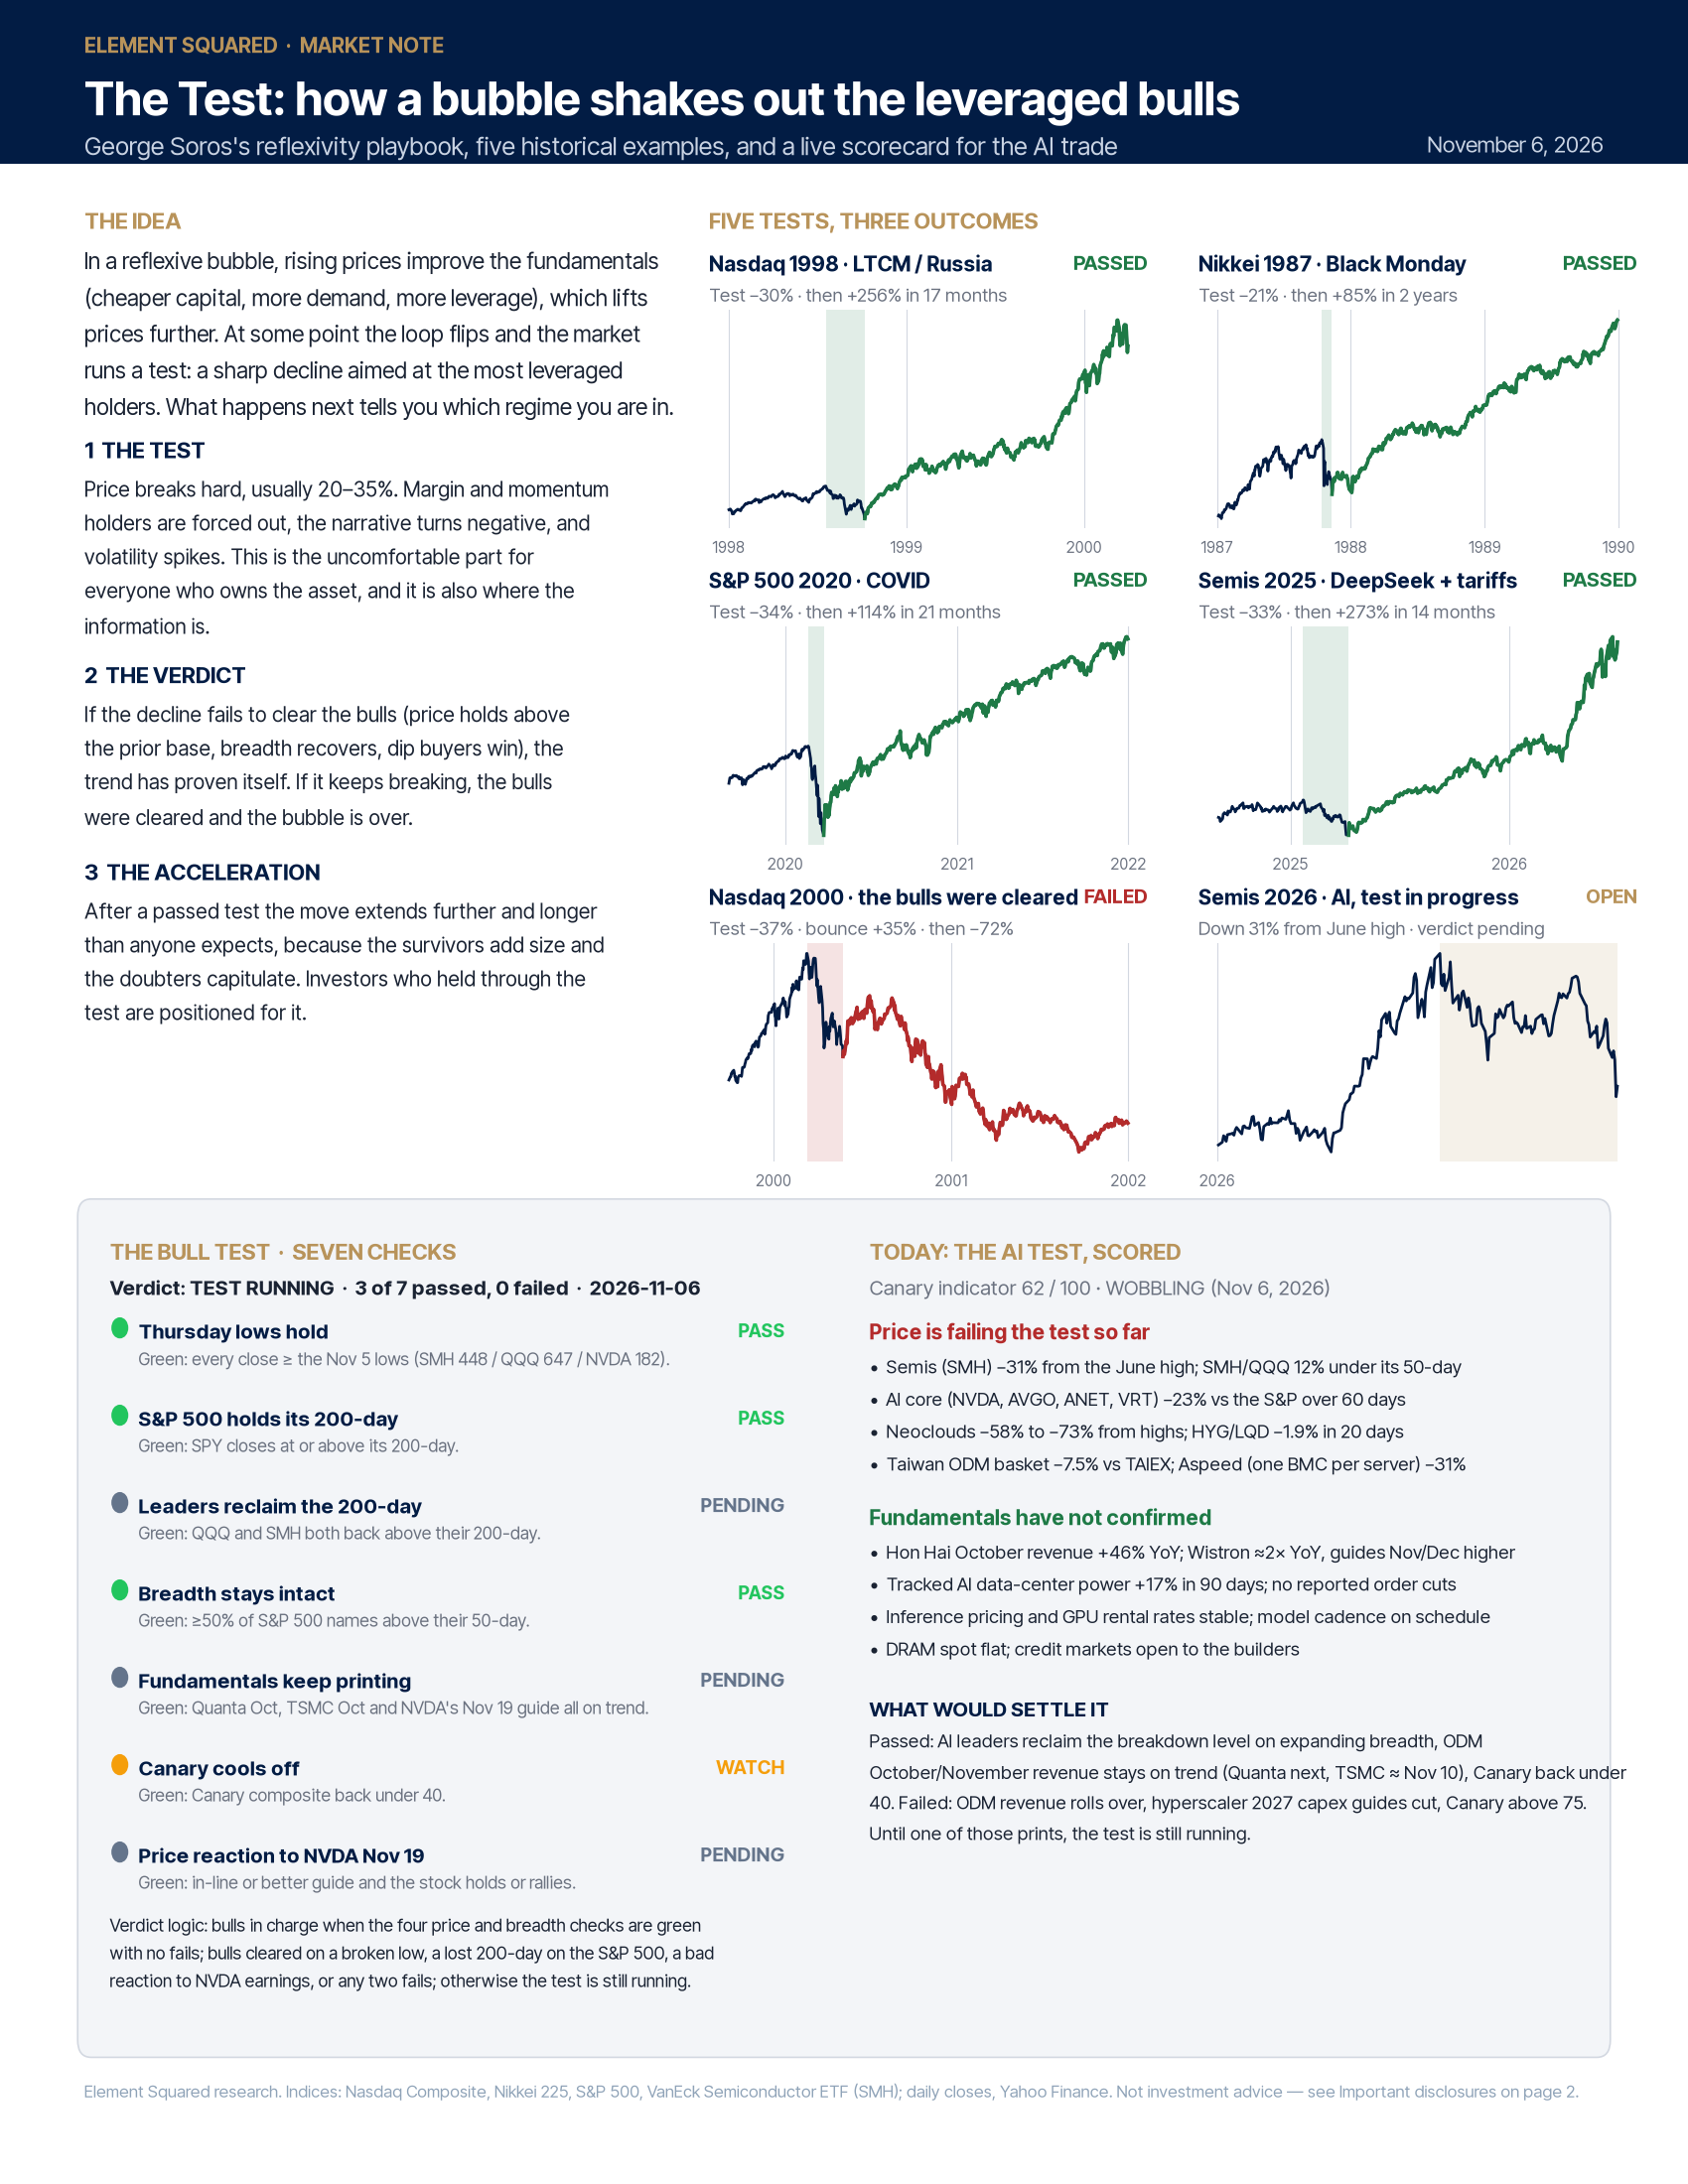
| Nasdaq 1998 · LTCM / Russia | Passed | Test −30%, then +256% in 17 months |
| Nikkei 1987 · Black Monday | Passed | Test −21%, then +85% in 2 years |
| S&P 500 2020 · COVID | Passed | Test −34%, then +114% in 21 months |
| Semiconductors 2025 · DeepSeek + tariffs | Passed | Test −33%, then +273% in 14 months |
| Nasdaq 2000 · the bulls were cleared | Failed | Test −37%, bounce +35%, then −72% |
| Semiconductors 2026 · AI | Open | Down 31% from the June high, verdict pending |
The passed tests share a pattern: the first break was violent, the low was set within two to three months, breadth recovered quickly and the leaders reclaimed their 200-day moving averages. The one failure looked identical for the first few weeks. The difference showed up afterward, when the bounce faded, the average stock kept breaking and good news stopped lifting prices.
Today: the AI test, scored
Price is failing the test so far.
- Semiconductors (SMH) are down 31% from the June high, and the SMH/QQQ ratio sits 12% under its 50-day average.
- The AI core (NVDA, AVGO, ANET, VRT) has lagged the S&P 500 by 23 points over 60 days.
- The neocloud names are 58% to 73% off their highs; high yield has slipped 1.9% against investment grade in 20 days.
- Our Taiwan ODM basket is 7.5% behind the TAIEX; Aspeed, which ships one controller chip per server, is down 31%.
Fundamentals have not confirmed.
- Hon Hai's October revenue grew 46% year over year; Wistron is running at roughly twice last year's pace and guided November and December higher.
- Tracked AI data-center power is up 17% in 90 days, with no reported order cuts.
- Inference pricing and GPU rental rates are stable, and the frontier-model release cadence is on schedule.
- DRAM spot prices are flat and the credit markets remain open to the builders.
Our Canary indicator, which tracks the health of the AI capital-spending chain, reads 62 out of 100 as of November 6, 2026. We label that range "wobbling": the price damage is real, but the supply chain has not yet confirmed it.
The Bull Test: seven checks
To keep ourselves honest we are scoring this test on seven checks, each with a rule set in advance. Current verdict: test running, 3 of 7 passed, 0 failed, as of November 6, 2026.
- The November 5 lows hold. Passing. SMH, QQQ and NVDA all closed above last Thursday's lows. A close 5% or more below any of them would mean the market is still clearing people.
- The S&P 500 holds its 200-day average. Passing. The index sits about 1% above it. Five straight closes below would mean the test has spread from AI to the whole market.
- The leaders reclaim their 200-day. Pending. Neither QQQ nor SMH is back above yet. Every passed test since 1998 did this within about two months; we give it until mid-December.
- Breadth stays intact. Passing. 63% of S&P 500 stocks are above their 50-day average. Below 40% would be the 2000 pattern, where the whole tape broke.
- Fundamentals keep printing. Pending. Quanta's October revenue, TSMC's October revenue (around November 10) and NVIDIA's November 19 guidance all need to stay on trend. One roll-over fails the check.
- The Canary cools off. Amber at 62. Under 40 passes; above 75 means the capex food chain is confirming the price damage.
- The price reaction to NVIDIA on November 19. Pending. A good guide with the stock down anyway would be the single most damaging tell. Good news that cannot lift price means the bulls have been cleared.
Verdict logic. The bulls are in charge when the four price and breadth checks are green with no fails. The bulls have been cleared on a broken low, a lost 200-day on the S&P 500, a bad reaction to NVIDIA earnings, or any two fails. Otherwise the test is still running.
How it settles
Passed: the AI leaders reclaim the breakdown level on expanding breadth, ODM October and November revenue stays on trend, and the Canary drops back under 40.
Failed: ODM revenue rolls over, hyperscaler 2027 capex guidance is cut, and the Canary rises above 75.
Until one of those prints, the test is still running. We will update this scorecard as the data arrives.
Element Squared research. Indices and funds shown: Nasdaq Composite, Nikkei 225, S&P 500, VanEck Semiconductor ETF (SMH); daily closes from Yahoo Finance. Company revenue figures from monthly filings with the Taiwan Stock Exchange.
Important disclosures
Not investment advice. This commentary is provided for general informational and educational purposes only. It reflects the opinions of Element Squared as of the date shown, which may change without notice, and it is not personalized investment advice, an offer, or a recommendation to buy or sell any security or to adopt any strategy. Any investment decision should follow a full review of your objectives, risk tolerance, time horizon, tax situation, liquidity needs and other holdings, ideally with a qualified professional.
Securities and indices mentioned. References to specific companies, funds, indices or price levels are for illustration only and are not recommendations. Element Squared, its clients or its employees may hold positions in securities discussed and may change those positions at any time without notice.
Risk of loss. All investing involves risk, including the possible loss of principal. Past performance, whether actual or hypothetical, is not a guarantee or reliable indicator of future results. Historical market patterns described here may not repeat, and indicators or frameworks discussed may fail to anticipate future market behavior.
Data and forward-looking statements. Market data is drawn from third-party sources believed to be reliable (including Yahoo Finance and company filings) but is not guaranteed for accuracy or completeness. Statements about future events, scenarios or outcomes are forward-looking, involve uncertainty, and may not come to pass. An investor cannot invest directly in an index.
Registration and fiduciary status. Advisory services are offered through Element Squared LLC, doing business as Element Squared Private Wealth, an investment adviser registered with the U.S. Securities and Exchange Commission. Registration does not imply a certain level of skill or training. As a registered investment adviser, Element Squared is a fiduciary and is required to act in its clients' best interests. Additional information, including Form ADV Part 2A and the firm's Client Relationship Summary, is available upon request and at adviserinfo.sec.gov.